Knoema
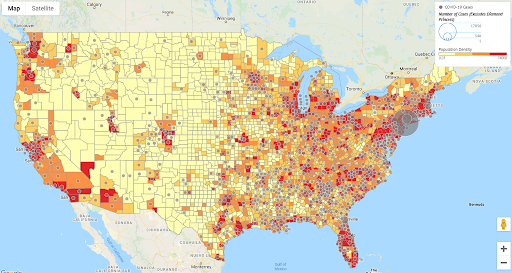
https://knoema.com/nrswcjf/coronavirus-pandemic-in-u-s-regional-breakdown
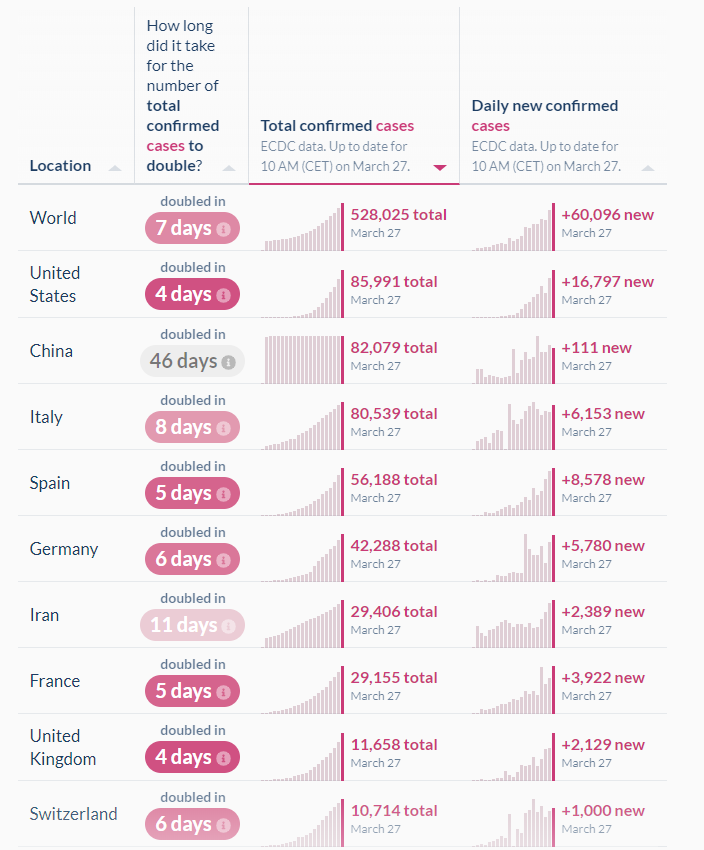
Our Word in Data
This chart shows a view into the rate of infection, showing how long it has taken for confirmed cases of the virus to double. Views like this show the relative trend and can show how successful a country has been in “flattening the curve”.
Worldometers
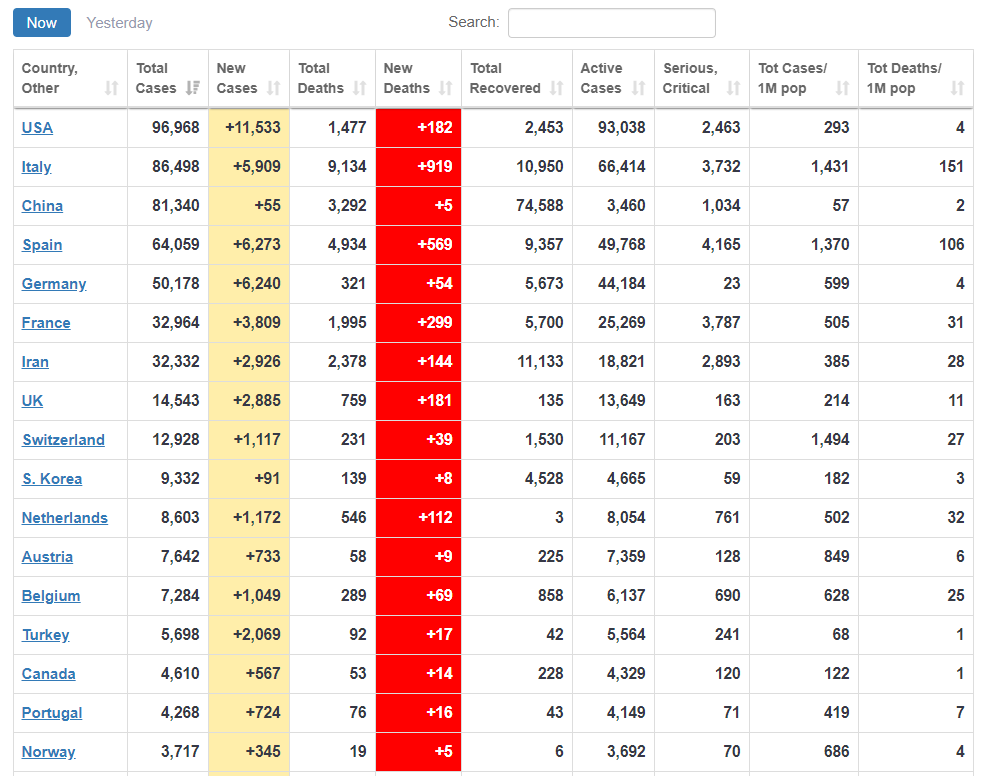
https://www.worldometers.info/coronavirus/